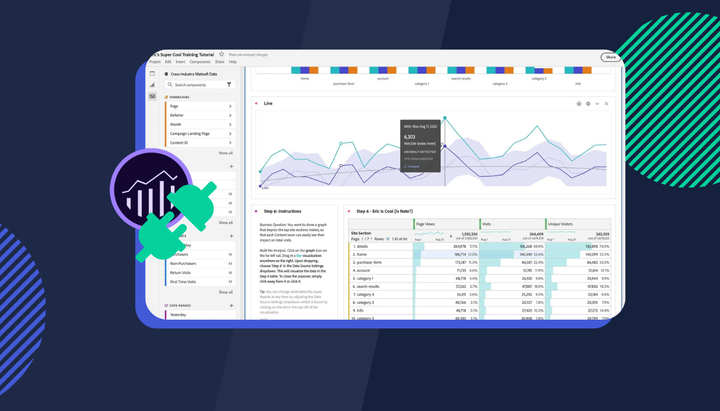
Get Day 1 insights from In-Page Analytics
We are very excited to announce the release of Insightech In-Page Analytics feature, which works with dynamic pages and single-page applications out-of-the-box
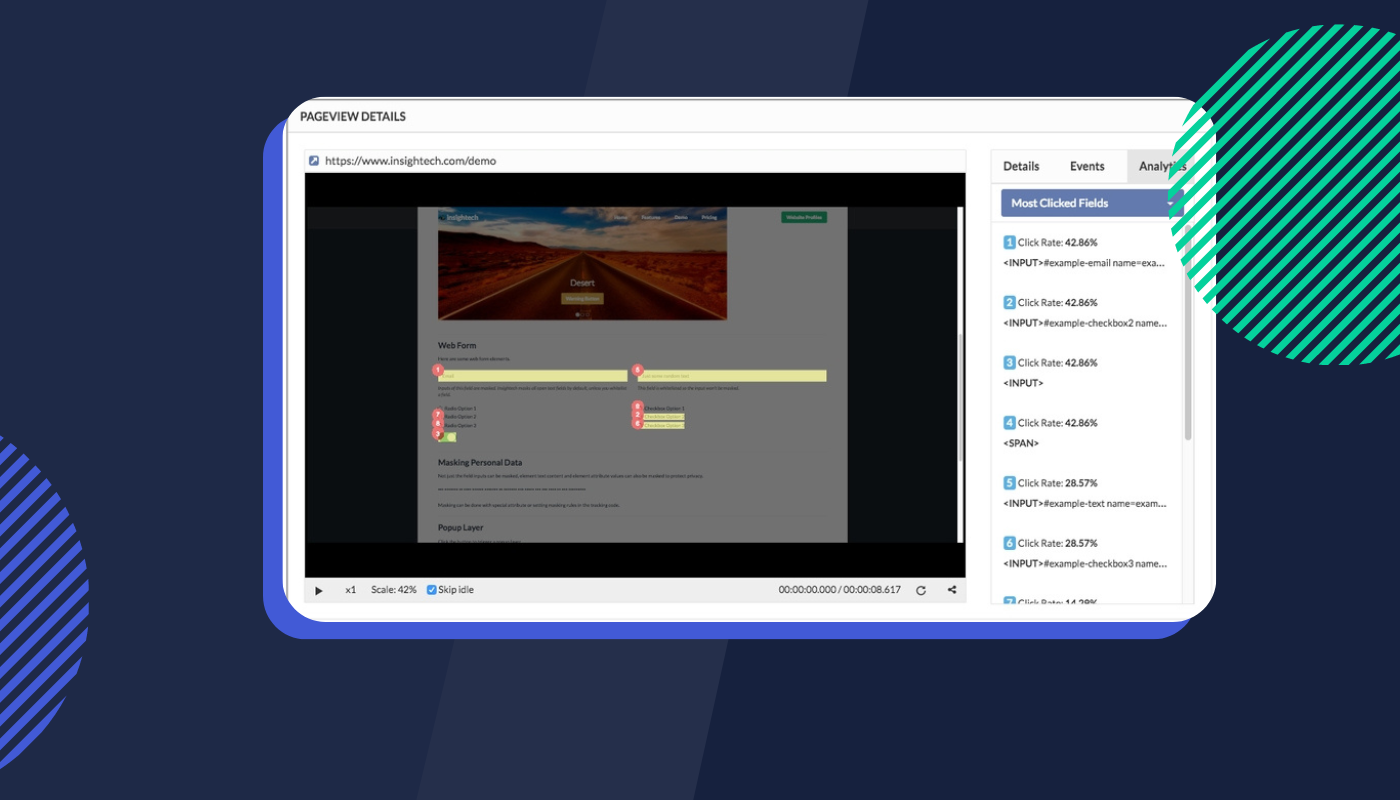
We are very excited to announce the release of Insightech In-Page Analytics feature, which works with dynamic pages and single-page applications out-of-the-box. You can access the in-page analytics feature by clicking on the Analytics tab in the replay user interface.
The current version offers three options for in-page analytics:
- Most Clicked Links: This option will list the clicked links (<a> elements) with click rates in descendant order, and highlight the links on the page in the playback window. It helps you gain insights on landing pages.
- Most Clicked Fields: This option will show click rates of fields (<input>, <textarea>, <select> and <label> elements) only. It is designed to work with forms, even single-page applications forms that are deep inside the funnel. Form analysis is quick and simple with in-page analytics.
- Most Clicked Elements: Modern web page design often requires a lot of techniques in stylesheet and HTML to achieve. Your form fields could be constructed with <div> elements instead of standard field elements. This option helps you to handle any challenges.
For dynamic pages, or single-page applications, you can pause the playback at any time and activate in-page analytics by choosing one of the three options.
The feature will show you relevant data at the current playback, which means if the replay is on step x of a single-page application, it will be able to show you the field clicks of step x.
By clicking on an element in the element list of the in-page analytics feature, it will hide the other clicked elements in the replay window to make it easier for you visually find the element in the replay window.
Here is an example screenshot of only highlighting the Close button in the popup of our live demo page.

How is in-page analytics different from heatmap?
Heatmaps overlay user activities on a static image and it works fine with static pages, however most web pages are dynamic or personalised nowadays. We put in-page analytics inside replay so that you can gain insights about how real visitors interact with the dynamic elements of your websites.