Click Maps Drive User-Friendly Journeys in Insurance and Financial Services
Discover how Click Maps revolutionise user experience in the insurance and financial services industry. Learn to optimize key touchpoints, enhance decision-making, and drive conversions with your analytics data.
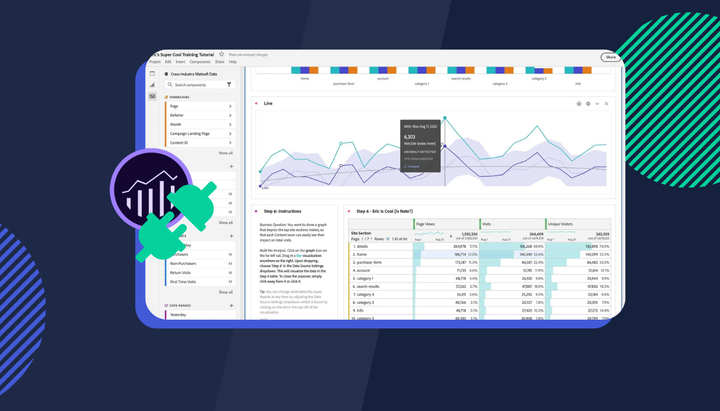
Guiding users through your website's complex network of information and choices is no small feat. Click Maps from unsampled data help provide visibility over how users behave on your website.
Our internal data found the median homepage scroll depth for insurance and financial services is just 17% or put another way only 45% of users scroll past the median fold (source: Insightech).
With so much important information and product offerings often sitting below this point you need to figure out what homepage content needs to be promoted above the average cut off point. Digital experience insights from Click Maps can help solve this problem. Let's dive in!
There's power in visualising click data
In the insurance and financial services industry, your website is a network of critical touchpoints – from the homepage to quote forms. You need to know where users are getting stuck, taking wrong turns, or cruising smoothly. Clickmaps help you see all this in real-time.
They're a visual tool that shows where users click, hover, or ignore, giving you a bird's-eye view of their online journey. This insight is gold for digital product owners who need to grow their analytics capability and use clear insights to make decisions.
4 key touchpoints to optimise with Click Maps
Visualising where users are clicking on your page design helps communicate a clear story. Here are a few areas of the website where clicks and page design can combine to produce some truly unique insights into user behaviour:
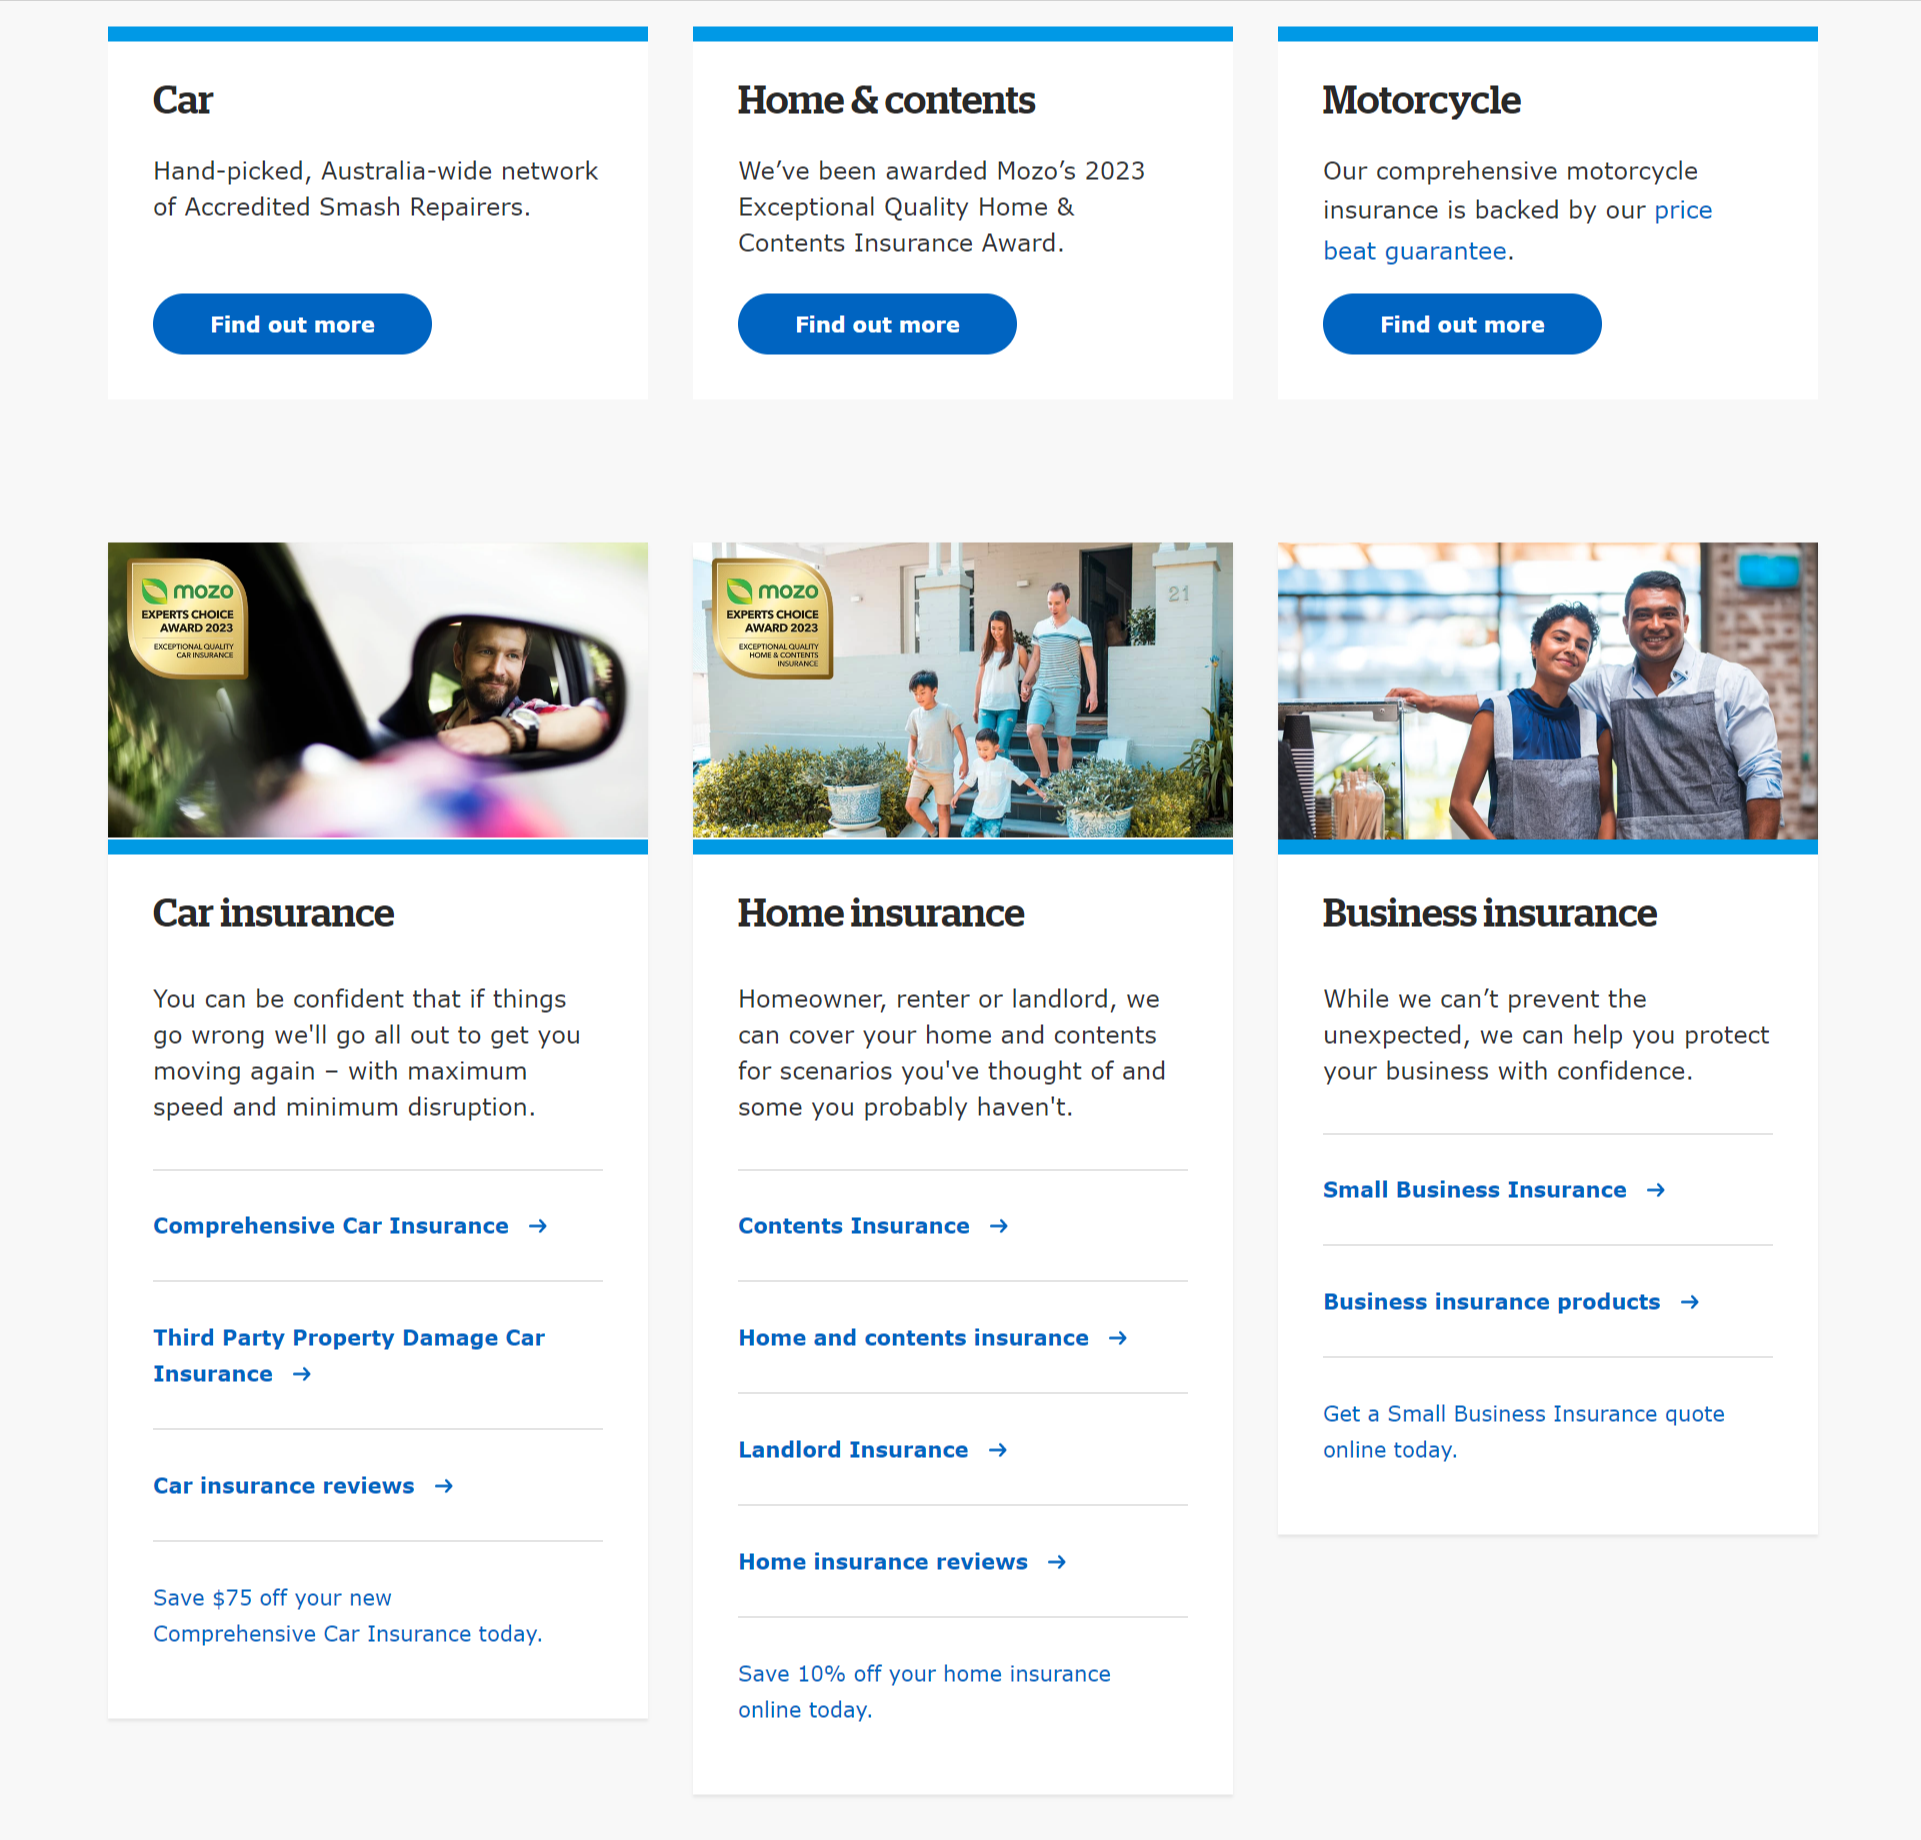
Homepage Engagement: Often there are multiple products and offers running on the homepage. Click Maps help you understand which attractions (elements) are crowd-pleasers and which might be causing visitors to turn away.
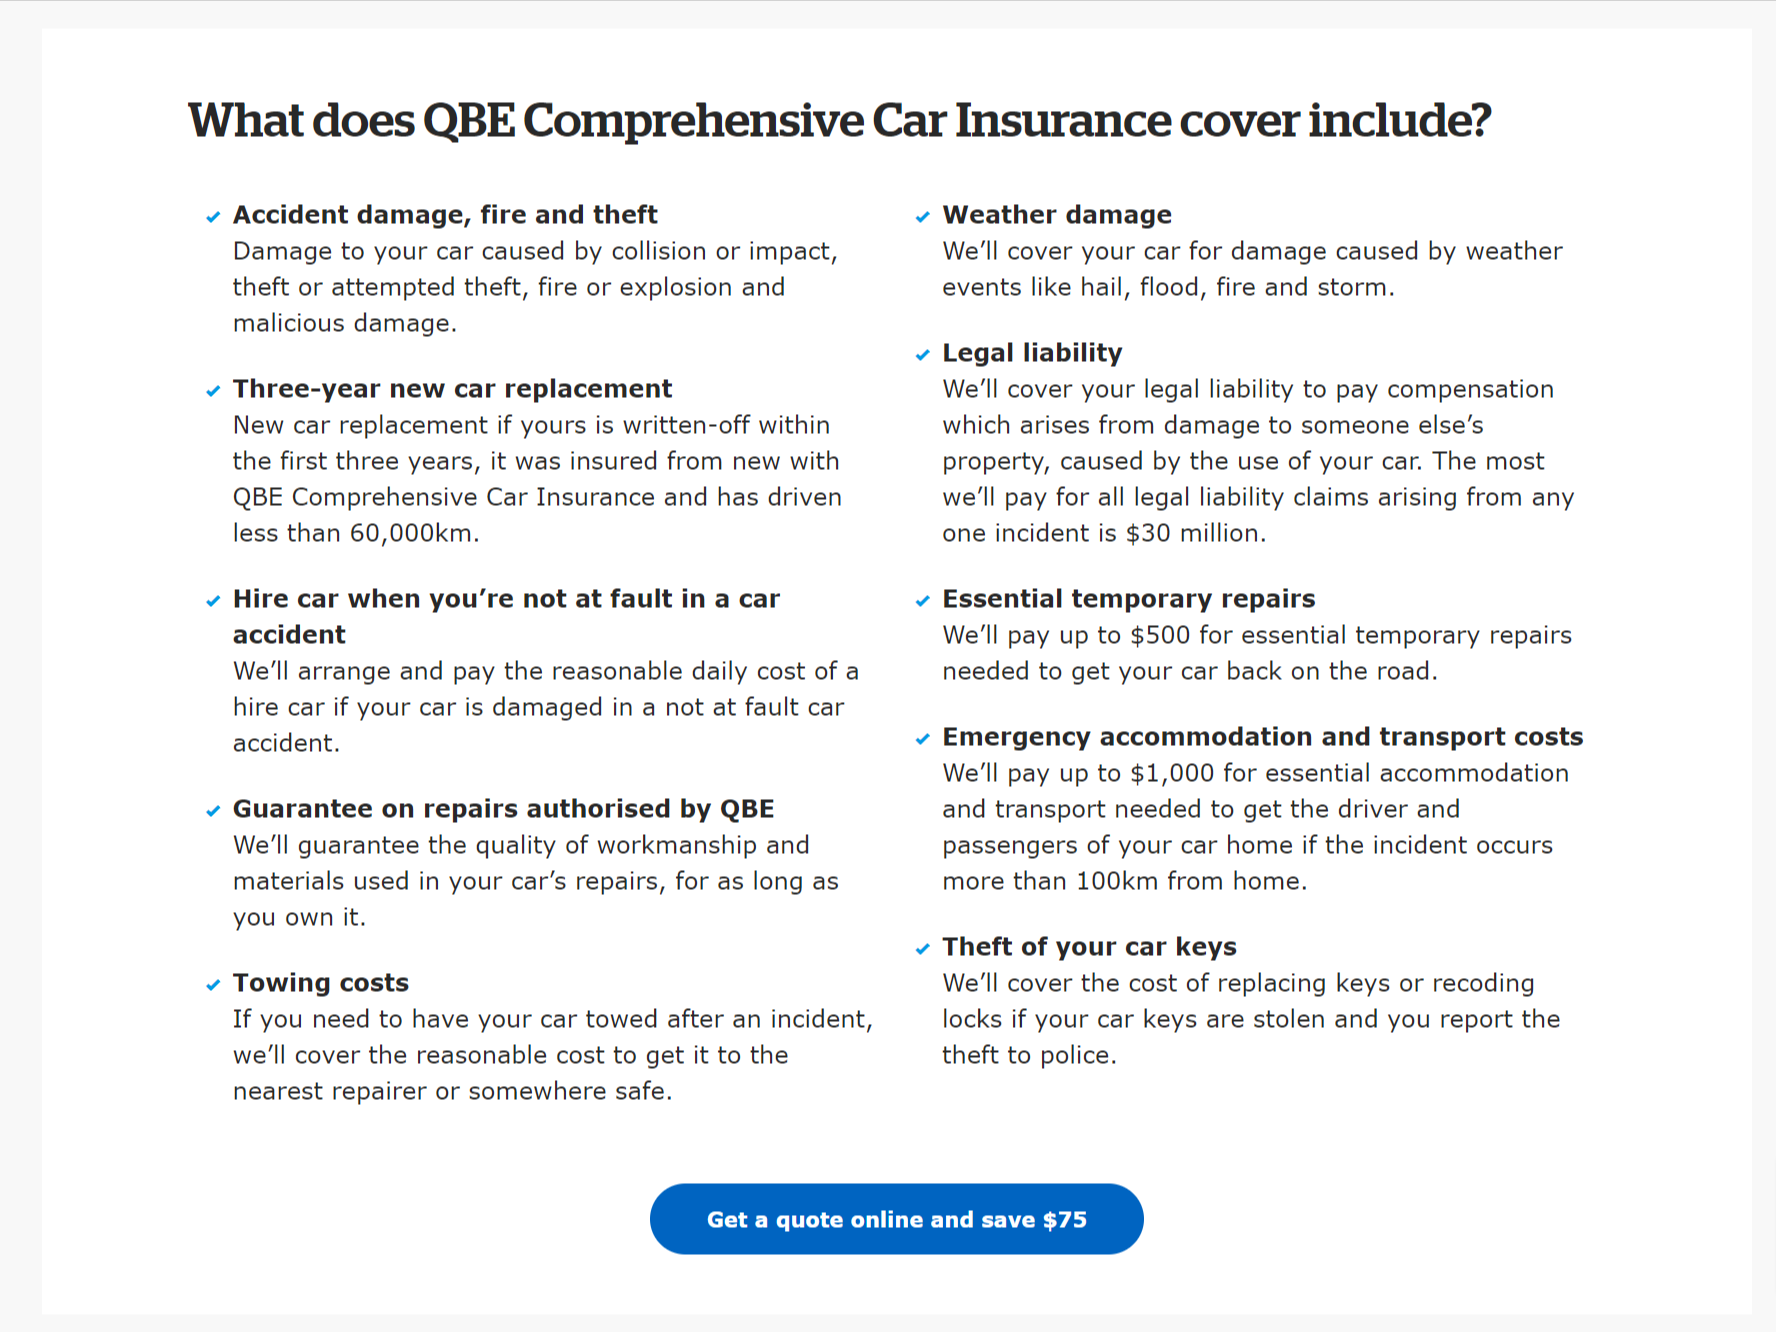
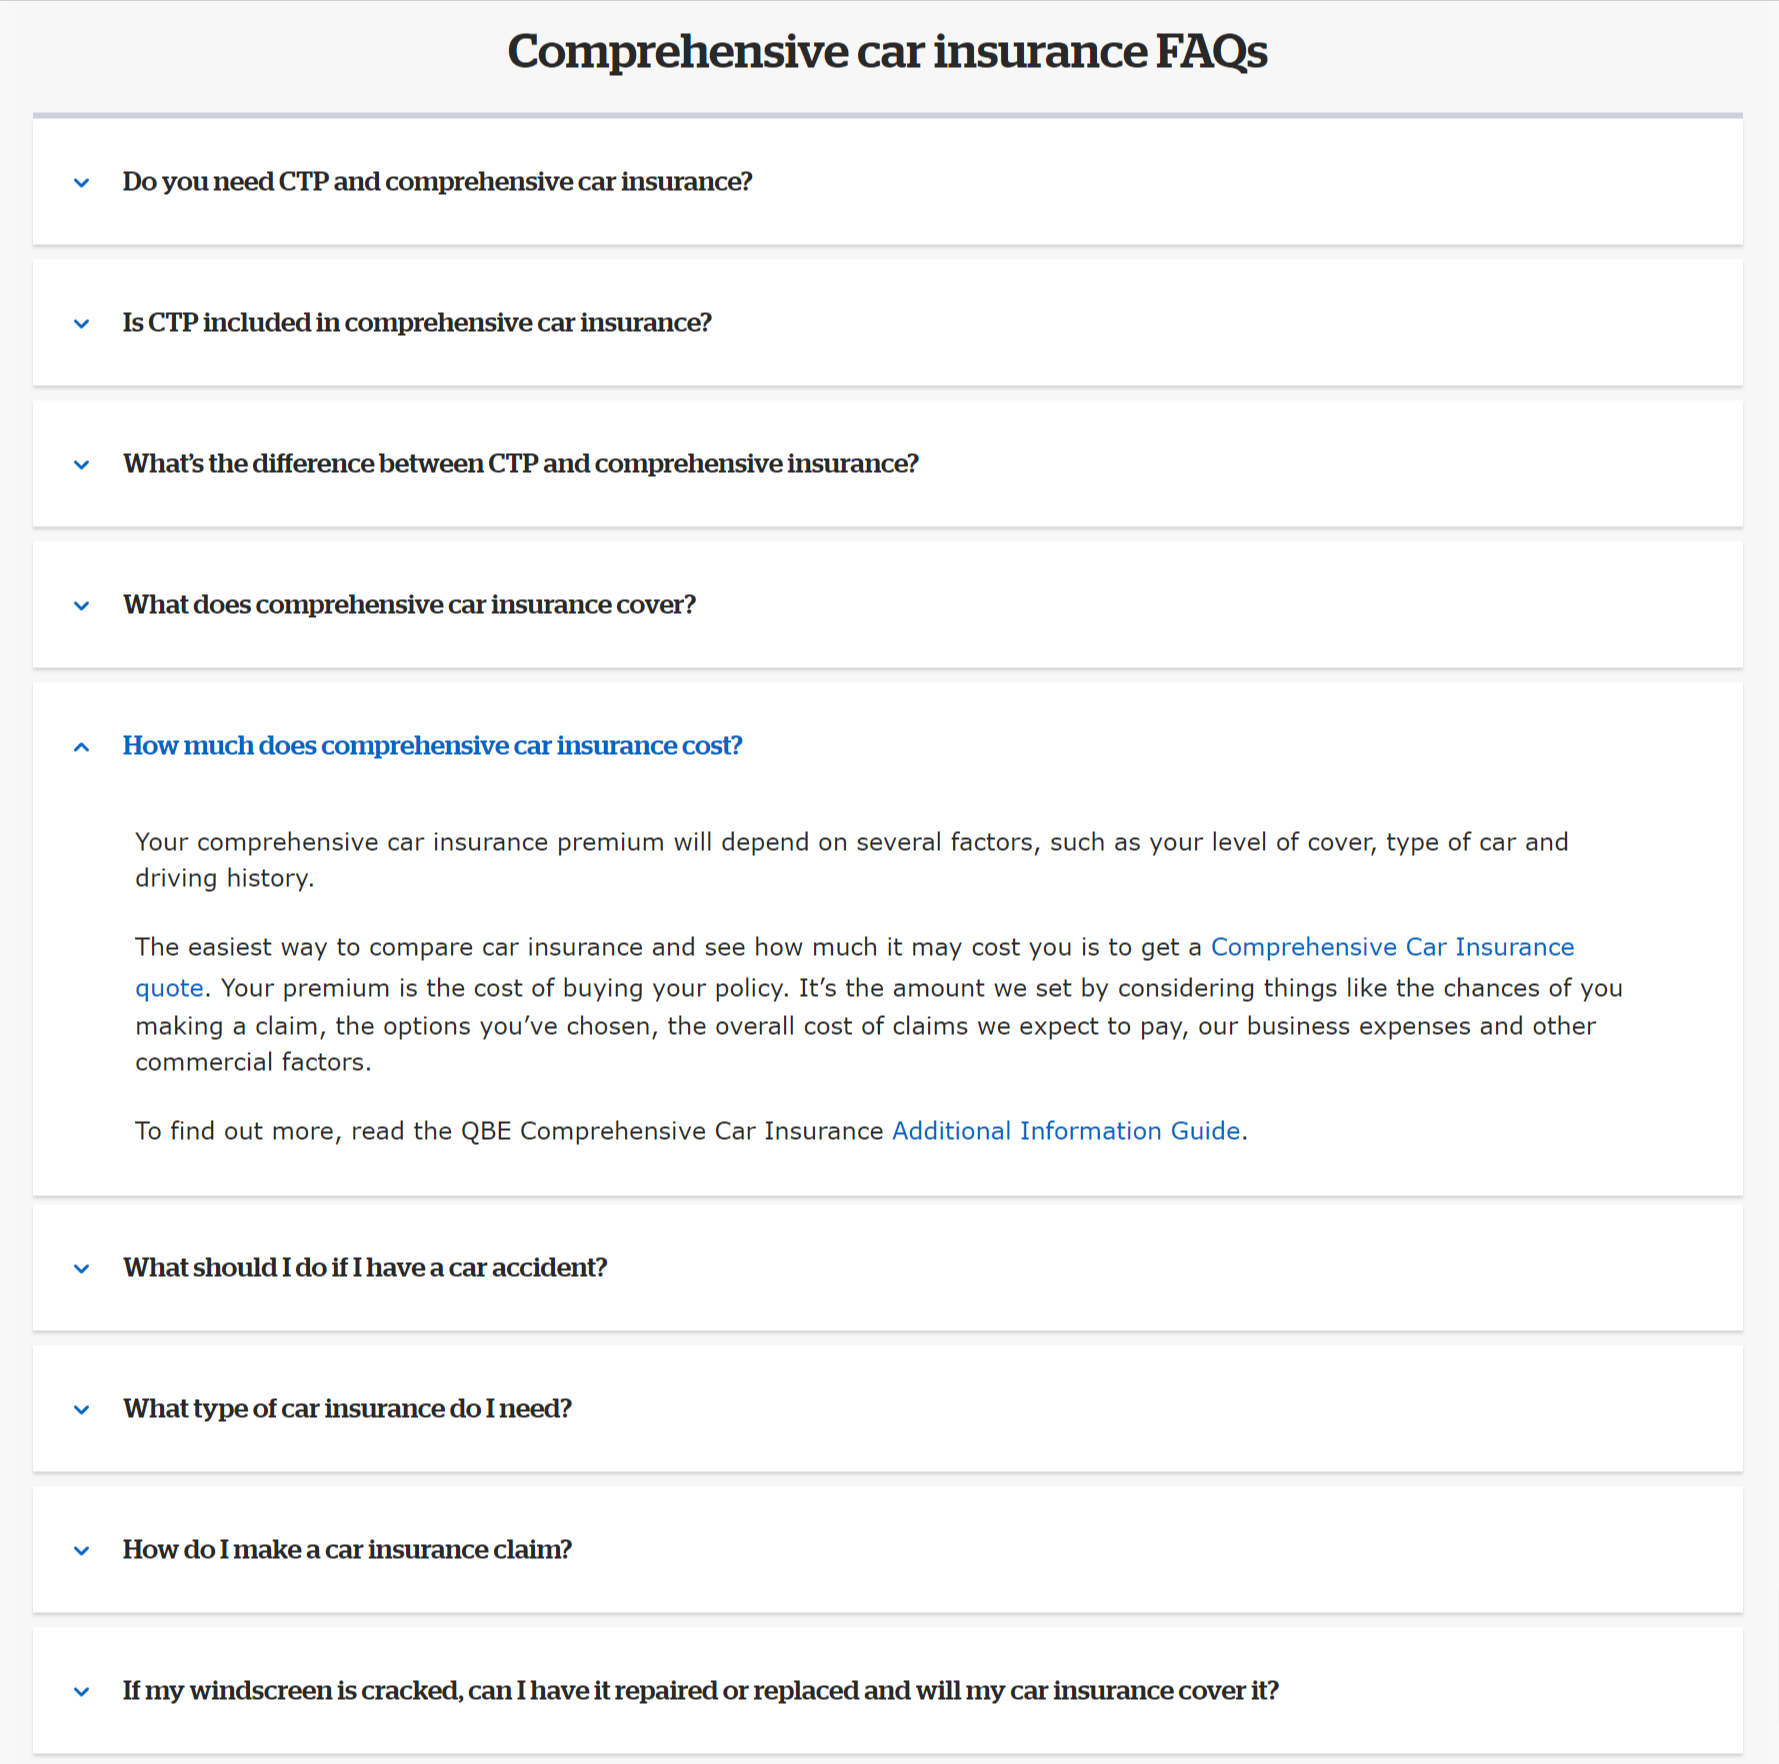
Product Information Pages: Insurance and Financial Service product pages are always going to be information-heavy for compliance and legal reasons. While you can't cut the content out you can optimise which deserves a spot in prime real estate (such as in hero callout sections or above the fold). Rather than placing all the information on one page you could split it out across multiple pages or place the information into collapsible menus, then study the Click Map insights into which specific information users want to learn more about.
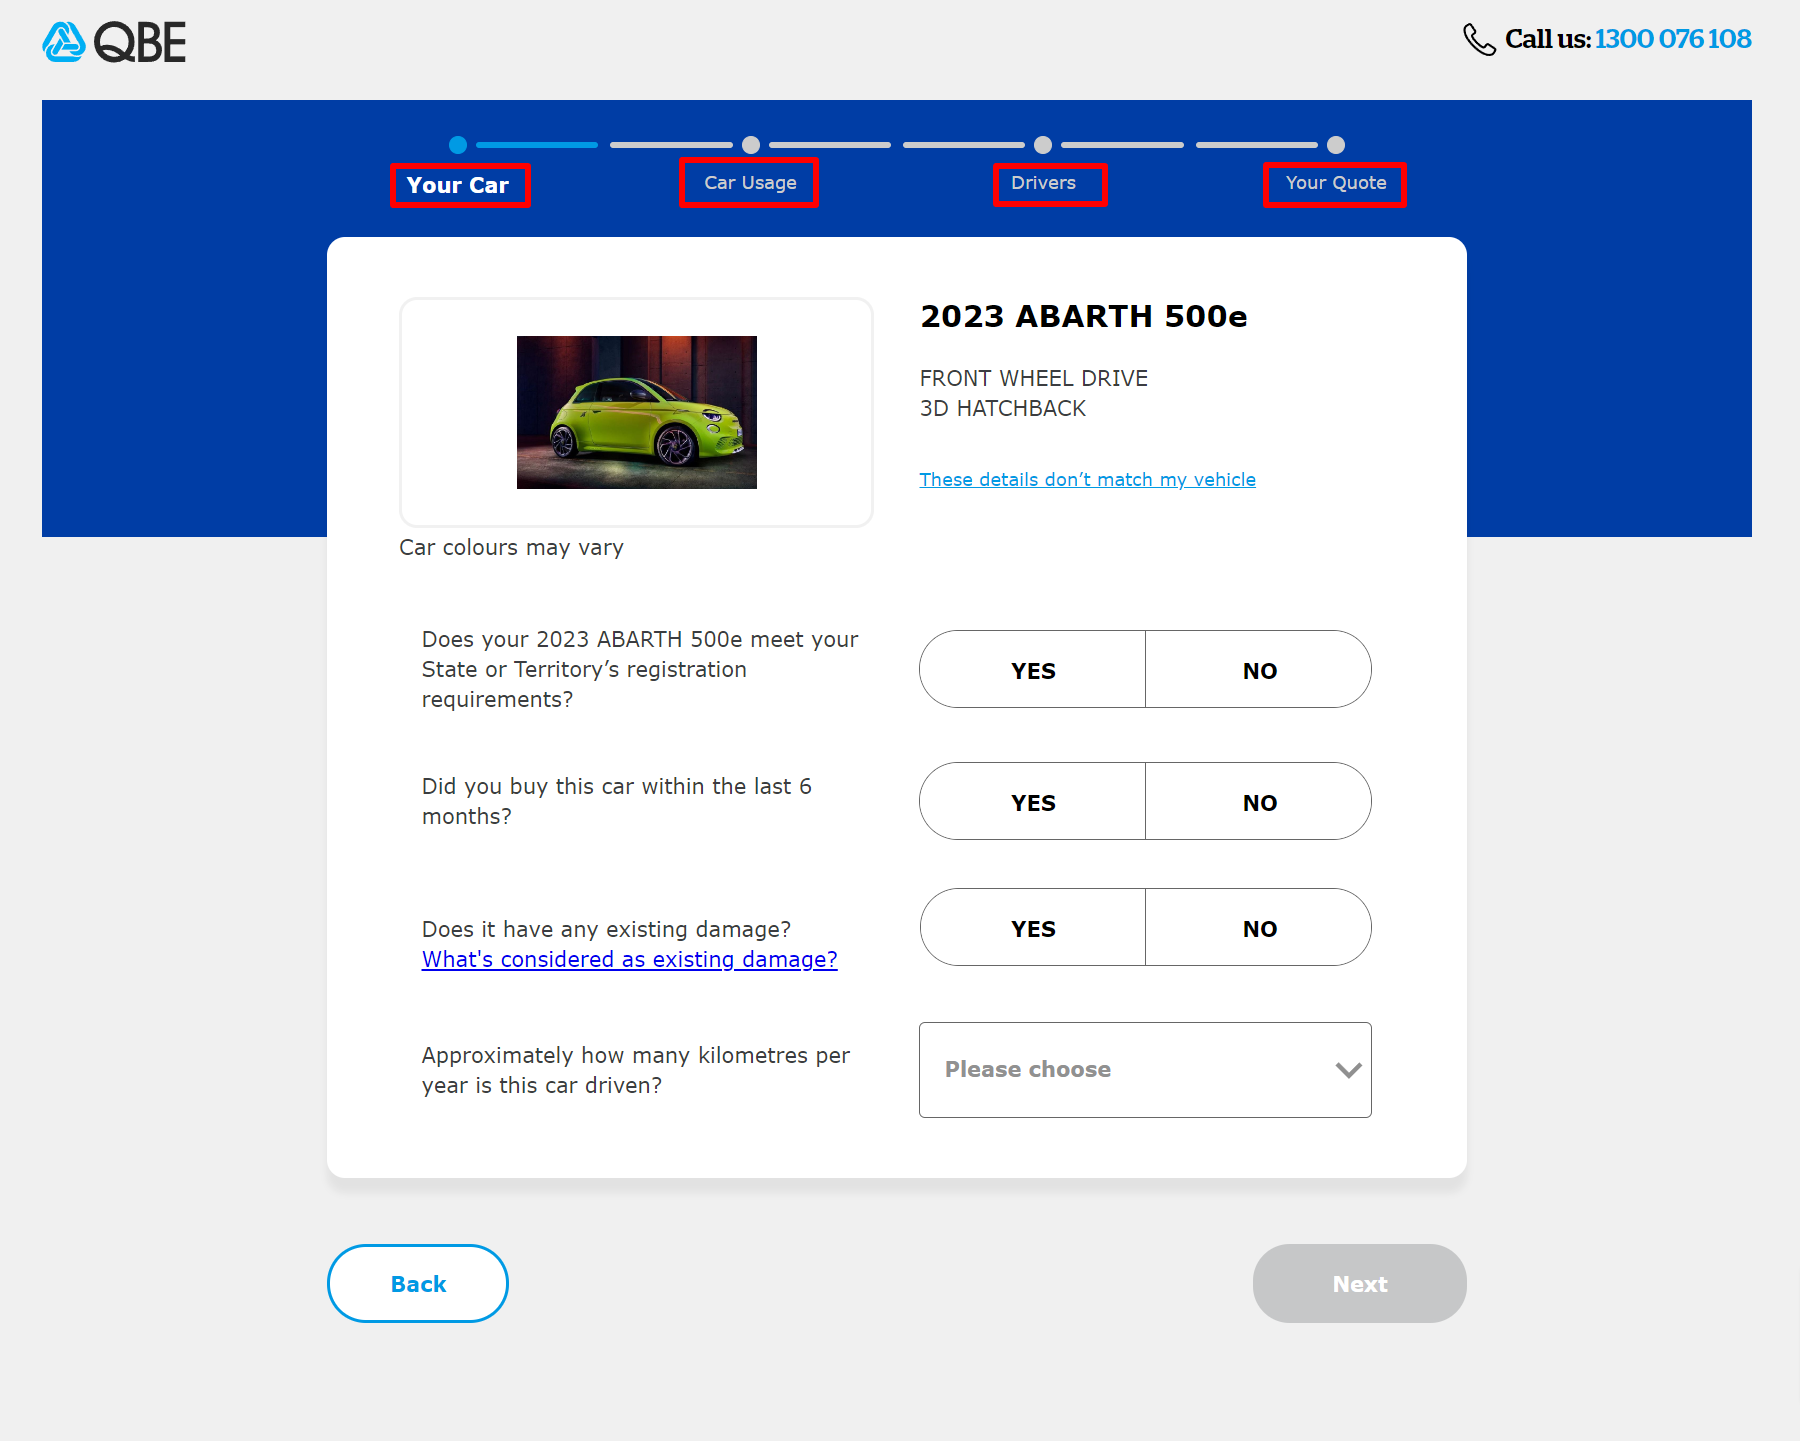
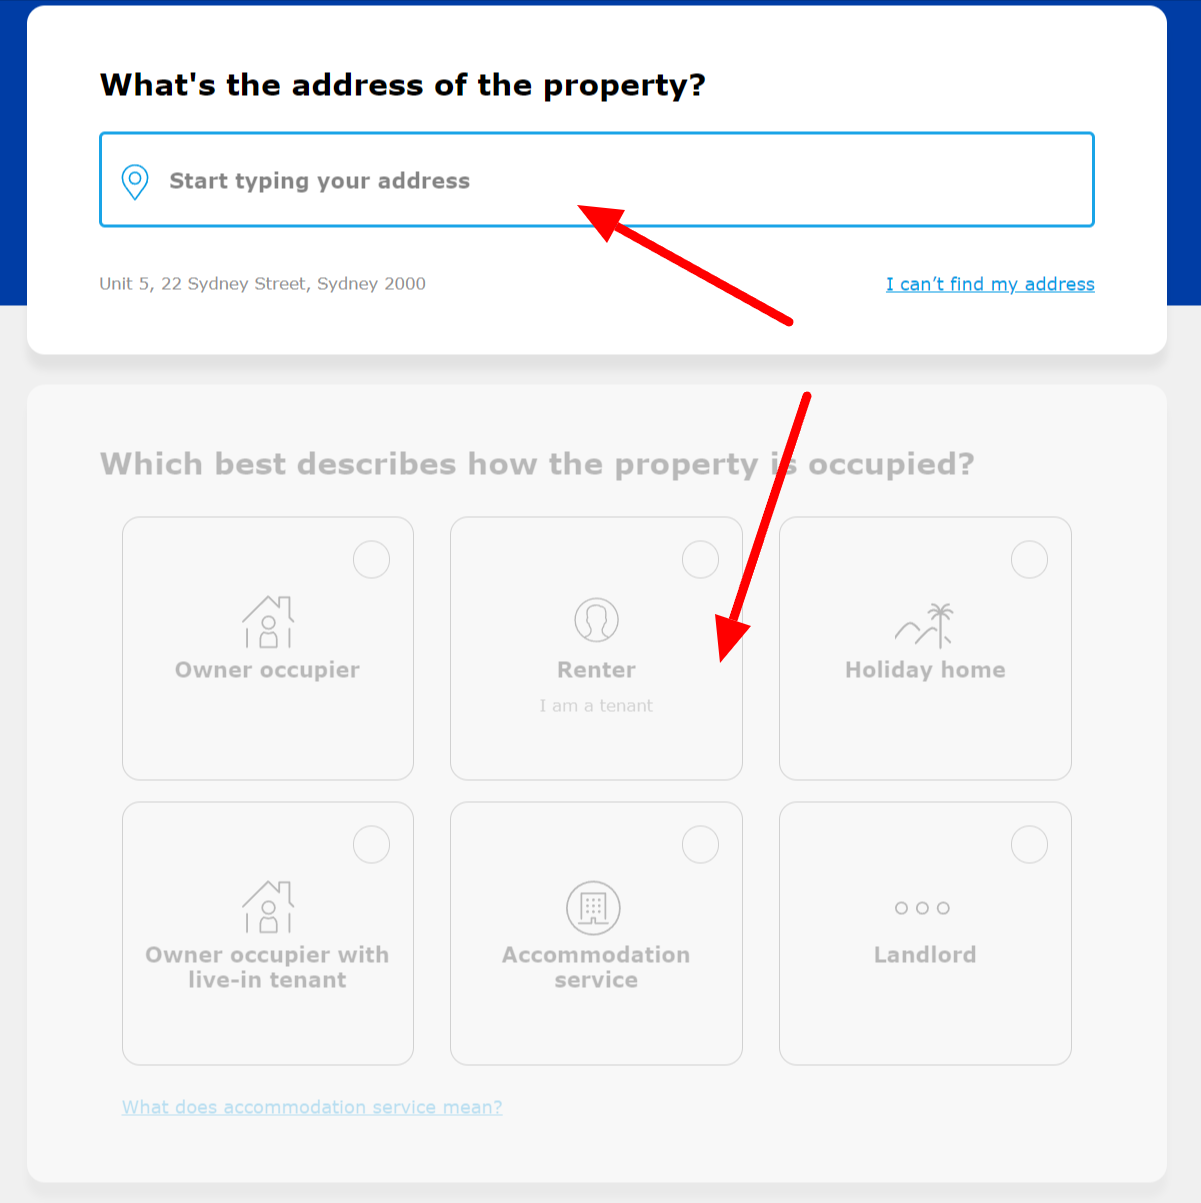
Quote and Buy Forms: This is where you ultimately want to capture and convert users so it's extremely useful to understand what they do on your Quote and Buy forms. Click Maps can visualise the elements and form fields that get clicked on as part of the digital journey. We recently wrote a helpful article about streamlining your Quote and Buy process here.
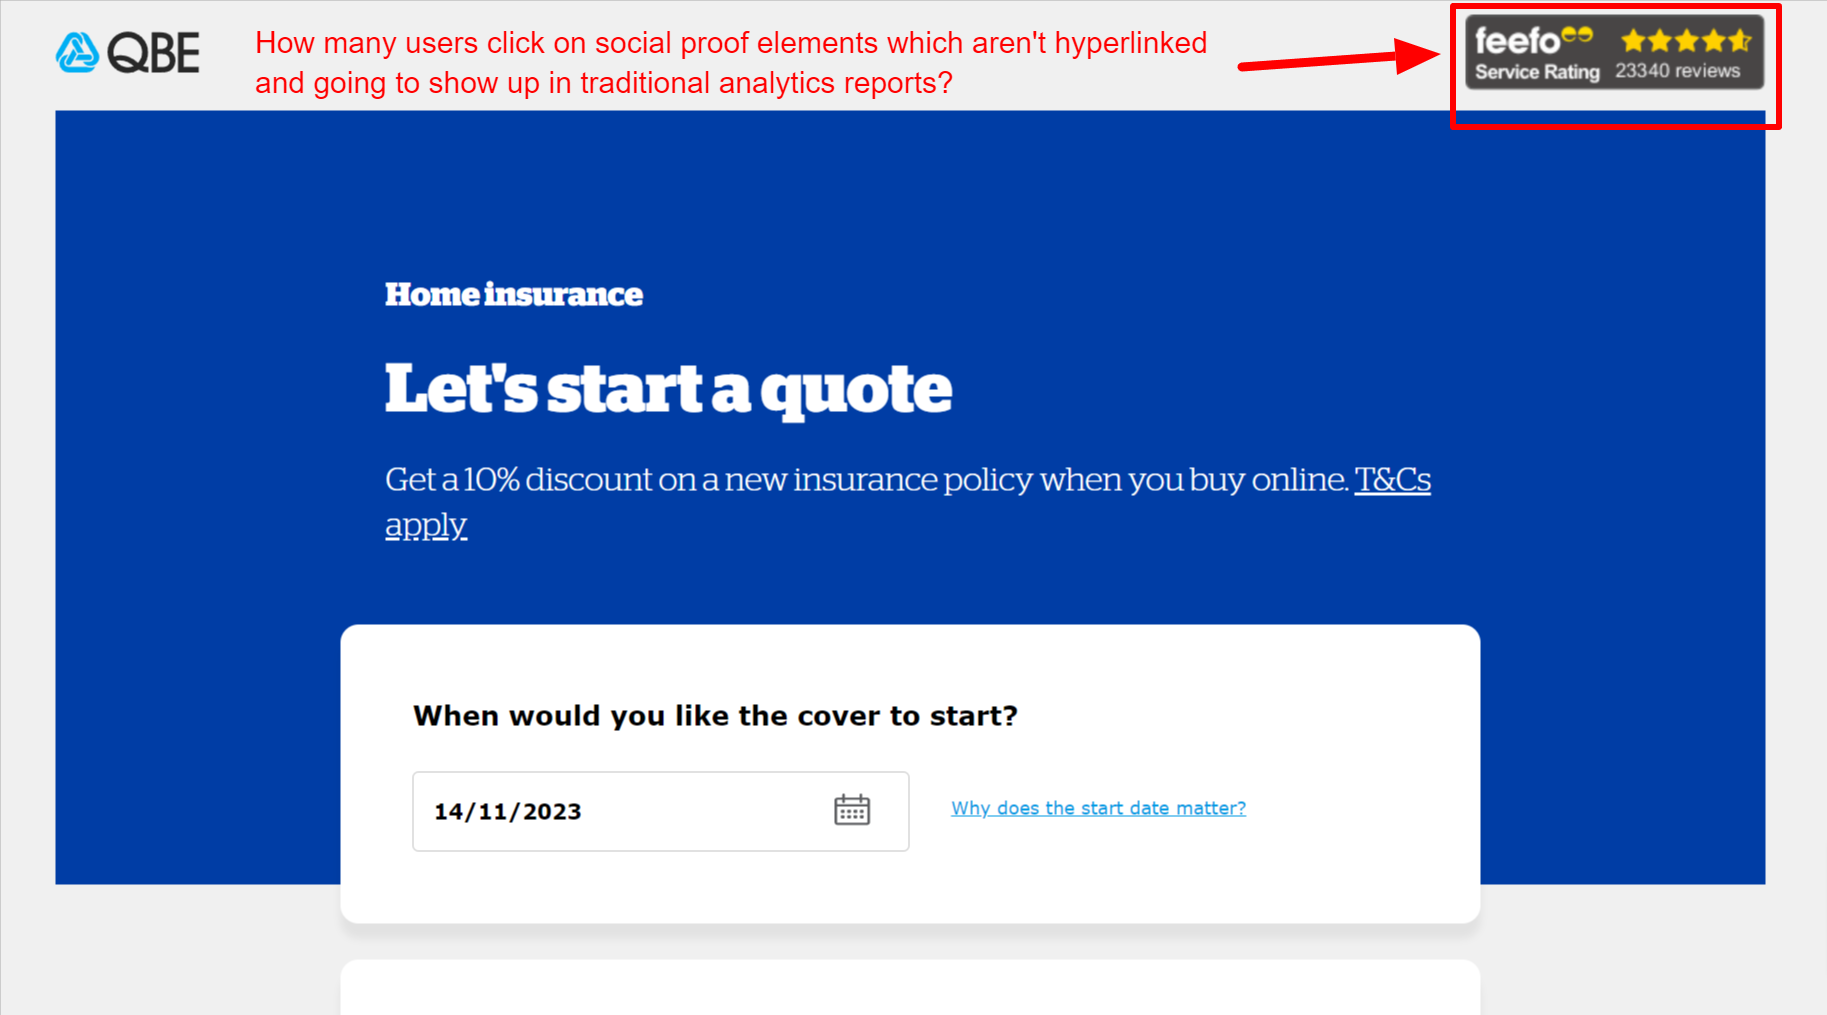
Customer Support and Chat Interactions: When a page design features support links a Click Map can also illuminate where and when users might need additional information. If you understand what information they are lacking you could add it to product pages, Quote and Buy forms or even the homepage.
How Insightech can help overcome these challenges
Insightech features several Click Map specific reports which are useful for understanding user behaviour on your website.
- Page Analysis Reports help you understand the top pages tracked across your website, and which of them have the highest and lowest engagement rates for the audience you want to understand.
- Click Map Reports help you understand what element or links users have interacted with on each page to understand which content is driving your website conversions.
- Form Analysis reports help you understand and identify potential issues related to your Quote and Buy forms. Unlike other experience analytics tools, our form analysis tools require no setup and work out of the box to provide you with immediate last-click and engagement insights. Our raw data can even be utilised to do in-depth analysis for quote and buy form redesign projects.
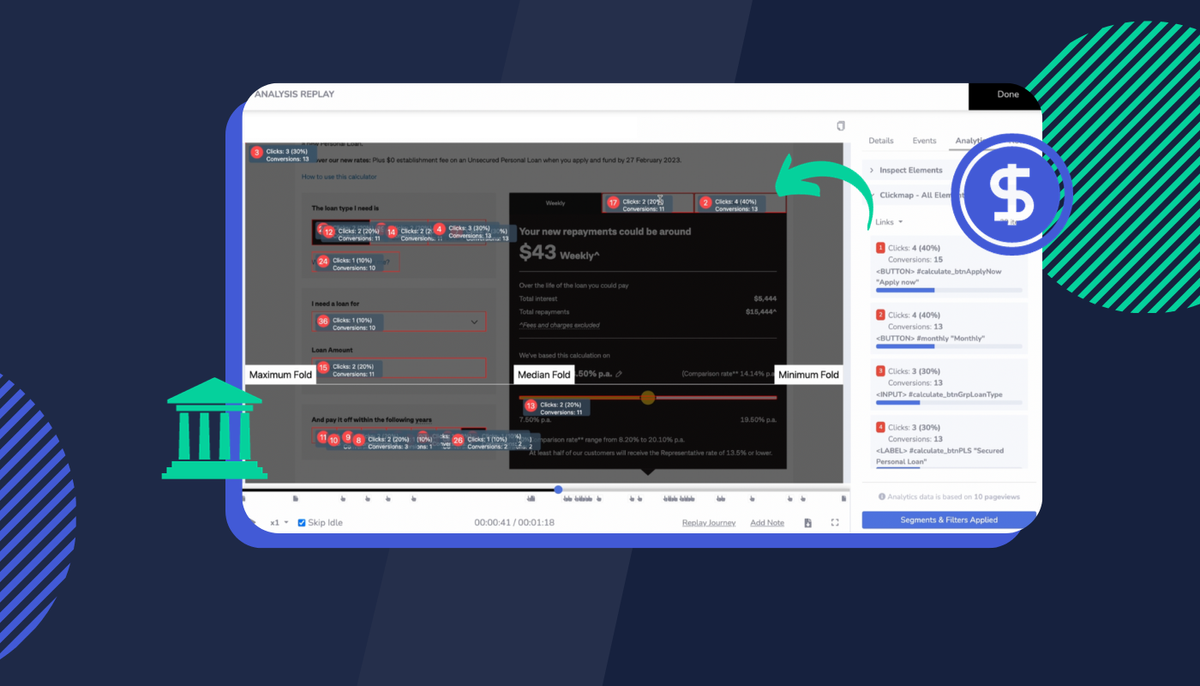
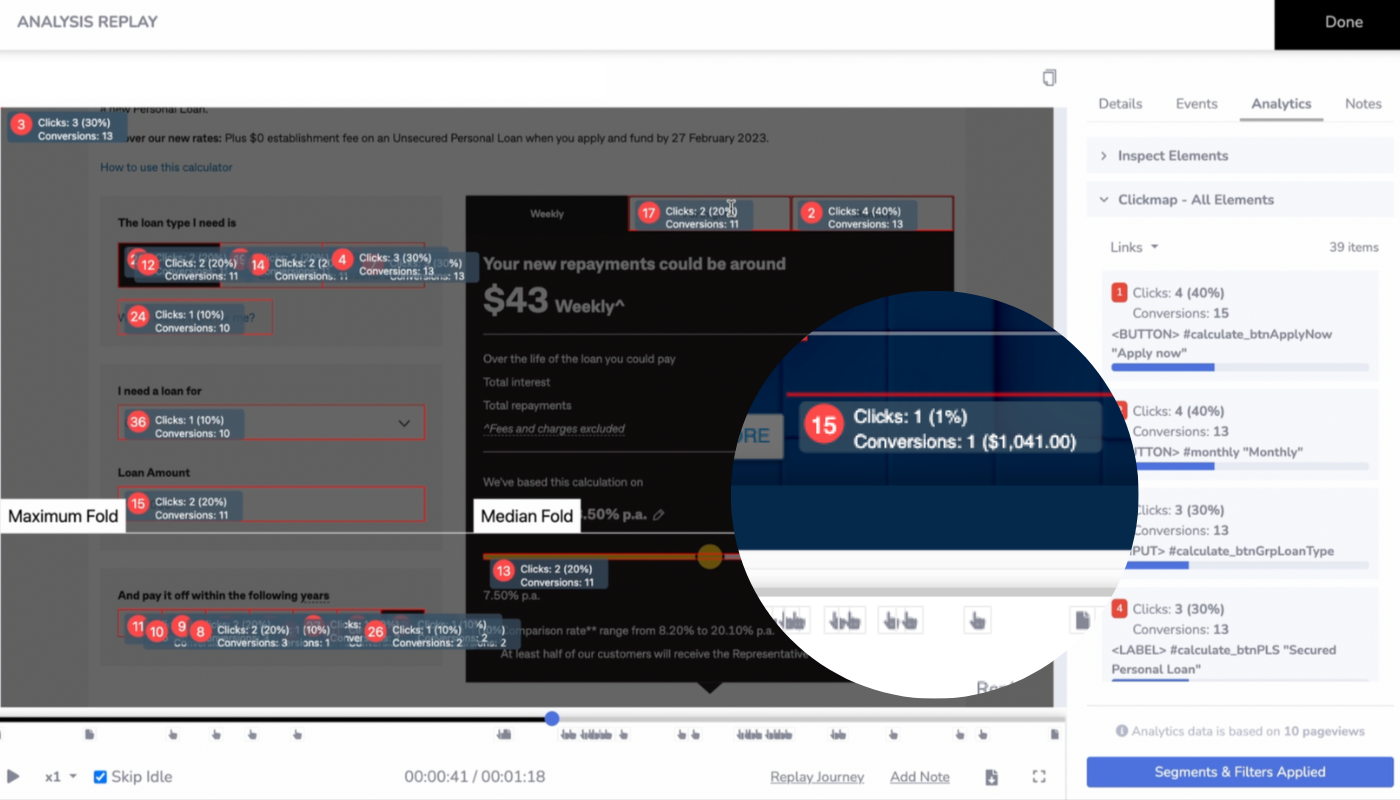
In addition, Insightech Click Maps display not just the number of clicks but also the conversion and revenue impact of each click.
10 ways digital product owners benefit from understanding revenue impact from Click Map data
Reporting not just the number of clicks from a click map but also the direct conversion rate and revenue impact of those clicks brings a wealth of benefits, especially for a digital product owner in the insurance or financial services sector.
Here's how this comprehensive approach can make a significant difference:
- Enhanced Decision-Making: By understanding not only where users click but also the direct outcomes of those clicks, digital product owners can make more informed decisions. This data provides a clear link between user behaviour and business results, allowing for more strategic planning and prioritisation.
- ROI-Focused Insights: Knowing the revenue impact of specific clicks helps in assessing the return on investment (ROI) of various website elements. This is crucial for justifying design changes, marketing strategies, and development efforts.
- Prioritisation of Features and Content: With insights into which clicks lead to conversions and revenue, product owners can prioritise the development and enhancement of features and content that drive the most value. This ensures that resources are allocated efficiently.
- Improved User Experience: Understanding the conversion and revenue impact of clicks helps in identifying what users find most valuable on the site. This information can be used to streamline the user experience, making it more intuitive and aligned with user preferences.
- Data-Driven A/B Testing: Using an optimisation tool such as AB Tasty or Optimisely? When conducting A/B tests, knowing the conversion and revenue impact of different design choices can lead to more effective iterations.
- Better Communication with Stakeholders: For digital product owners who need to report to other teams and leaders, having concrete data on how clicks translate to revenue is invaluable. It helps in communicating the effectiveness of digital strategies in a language that resonates with all stakeholders.
- Optimising Marketing Strategies: This level of insight is crucial for optimising marketing campaigns. Understanding which aspects of the website are most effective in driving conversions can inform more targeted and effective marketing efforts.
- Forecasting and Planning: With a clear understanding of how current user interactions impact revenue, digital product owners can more accurately forecast future performance and plan accordingly.
- Enhancing Customer Centricity: This approach aligns website improvements with what is most beneficial for the customer, fostering a more customer-centric approach. By focusing on what drives conversions, product owners are inherently focusing on what customers value most.
- Quick Identification of Issues: If certain clicks are not leading to expected conversions or revenue, this can quickly highlight areas of the website that may be underperforming or problematic, allowing for swift action and rectification.
In summary, integrating click data with conversion and revenue insights empowers digital product owners with a holistic view of their website's performance. It enables them to make more impactful decisions, optimise user experience and drive tangible business results, all while communicating effectively with other stakeholders in the business.
If you'd like to learn more, please reach out to our team here.