Pushing Boundaries in Experience Analytics: Unleashing the Potential of Auto-Tracking & Data Lakes
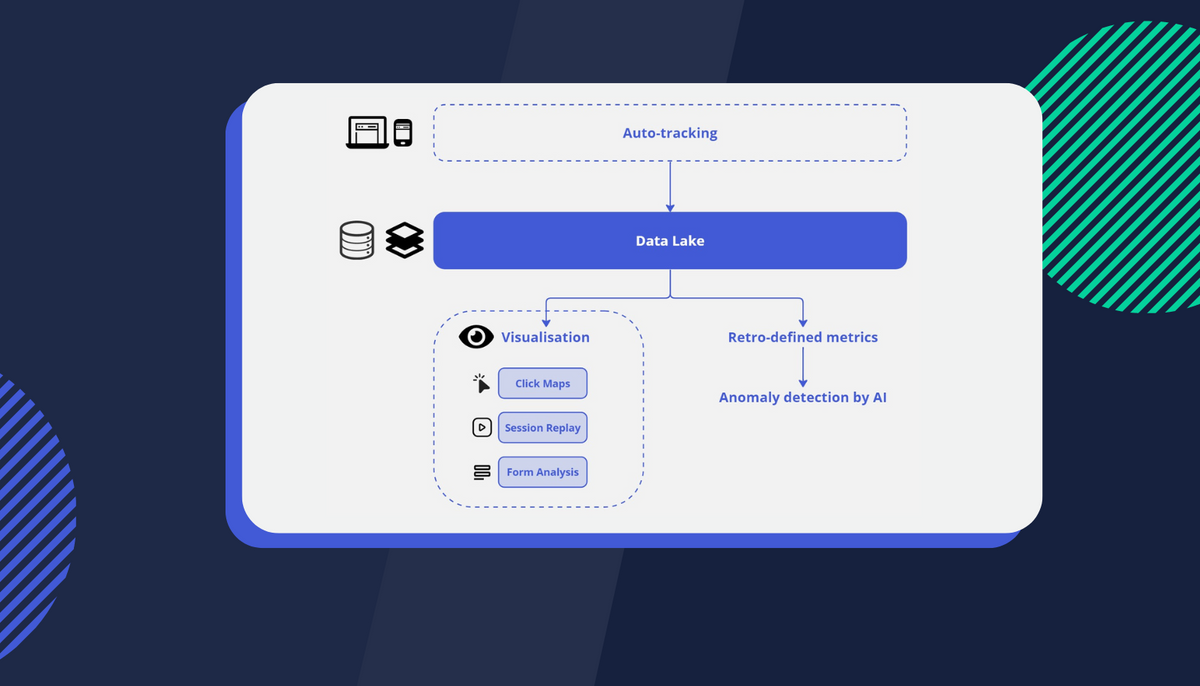
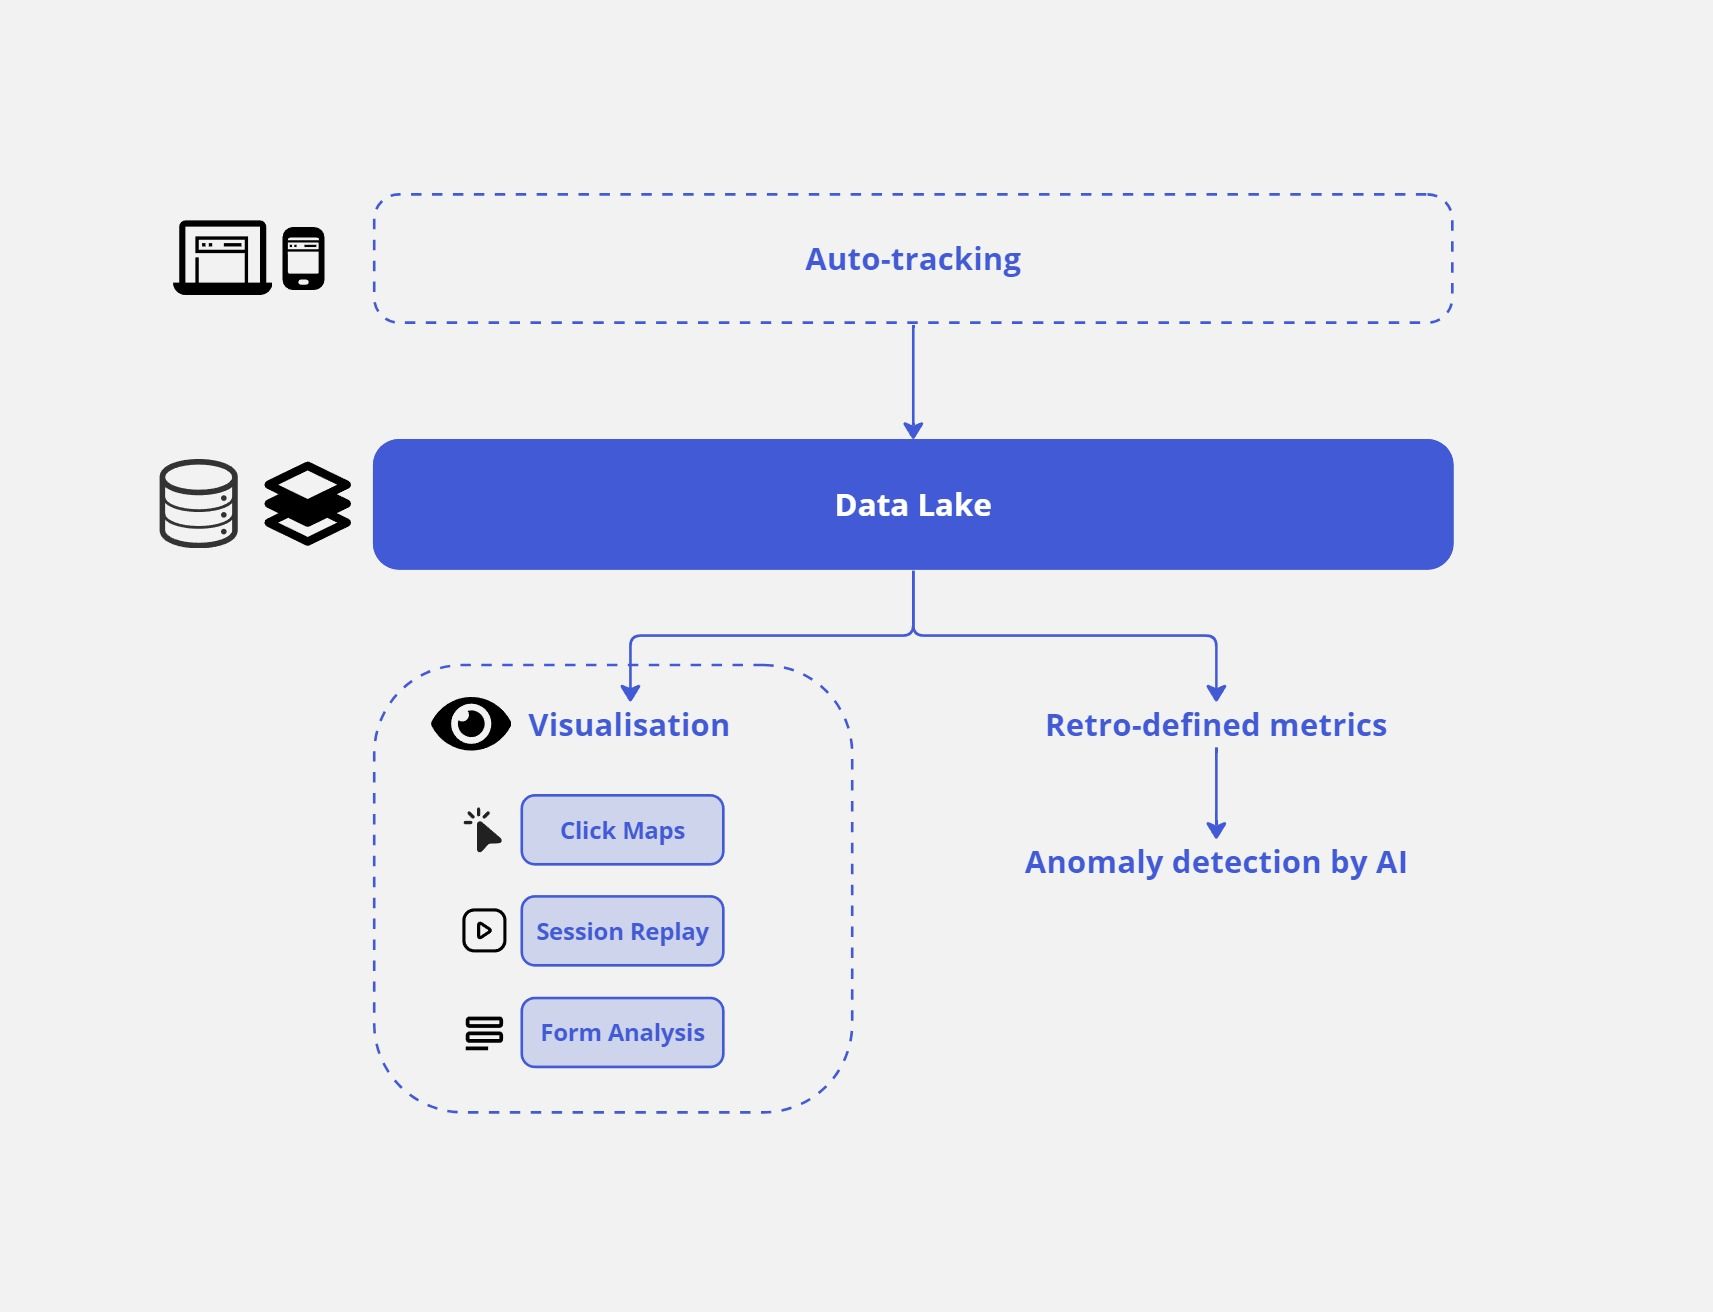
The Data Lake is a centralised repository for structured and unstructured data. Combined with auto-tracking it can take your website experience to the next level!
Key points:
- Auto-tracking is an efficient solution in experience analytics offering significant flexibility and improved data quality, especially when combined with Data Lake, a centralised repository for structured and unstructured data storage.
- Combining auto-tracking with your Data Lake allows for the storage of more raw data, more agile data-backed decision-making and is more resource efficient.
- Auto-tracking in combination with the data lake encourages further data democratisation through visualisation tools.
- Visual analytics in turn promotes a stronger data-driven culture by breaking down silos and progressively upskilling team members.
What does agriculture have in common with data and digital analytics? For the past 20 years, the way we track digital data has been likened to meticulously managed farms. Every data point was similar to a carefully sown seed, cultured and preserved for future use. Despite being effective, this precision-focused model has its drawbacks, the main ones being it's inflexible and requires significant resources to maintain.
Unveiling Auto-Tracking in Experience Analytics
Auto-tracking addresses these hurdles by effortlessly gathering all data points without needing to specify each one. This means an abundance of raw format data is assembled, offering remarkable flexibility for defining them retrospectively. For instance, recording all clicks on your web pages enables you to distinguish between “add to cart” clicks and “menu item” clicks based on the data attributes of each click. This ensures data quality, allowing for retrospective analysis without the concern of implementation issues or changes.
One might assume that acquiring more data prolongs the tracking implementation time. While this might hold true for traditional individual data point tracking, auto-tracking simplifies analytics implementation and bolsters data quality. For data to be employed in replaying sessions with perfect fidelity, it must record events down to the millisecond, mirroring real-time as much as possible.
Auto-tracking however does accumulate more data than traditional precision tracking. As big data technology evolves, especially with the advent of the Data Lake, auto-tracking becomes increasingly cost-effective and efficient!
Digital Analytics: The Power of Data Lake
So what is the data lake exactly? Simply put, a data lake acts as a centralised repository allowing storage of all your structured and unstructured data at any scale. You can store your data as-is, without any preliminary structuring, and execute different types of analytics—from dashboards and visualisations to big data processing, real-time analytics, and machine learning. These are all deployed in businesses to steer data and insights-based decision-making.
In the realm of digital customer experience analytics, digital interfaces like web browsers can be uniformly tracked, making it an ideal use case for integrating auto-tracking and data lake concepts. This captures all raw data while simultaneously enjoying flexibility and assured data quality. It seems you can indeed have your cake and eat it too! 🎂
a data lake acts as a centralised repository allowing storage of all your structured and unstructured data at any scale.
With auto-tracking, there's no concern about missing key button click data in your next release. This advantage enables business operators to swiftly make data-driven decisions and gain a competitive edge (particularly in the agile-demanding post-COVID environment).
Auto-Tracking & Data Lake: Pros and Cons
In summary, here are the benefits of merging auto-tracking with a data lake for digital analytics:
- Flexibility
- High data quality
- Quick implementation process
- Low maintenance effort
But what are the potential pitfalls? One downside might be the escalated operational expenses due to processing a larger data volume. However, these costs are offset by a decrease in maintenance costs and increased flexibility in data collection and use. Having all data in its raw, unprocessed state accelerates the build-measure-learn cycle, allowing businesses to focus on learning and making rapid, data-backed decisions.
Another challenge could be interpreting a massive amount of data. At Insightech, we address this challenge through visualisation. By contextualising data with visualisation, you bypass the need to define each data point meticulously, making it easier for stakeholders across your business to understand the data and promote data democratisation.
With auto-tracking, there's no concern about missing key button click data in your next release.
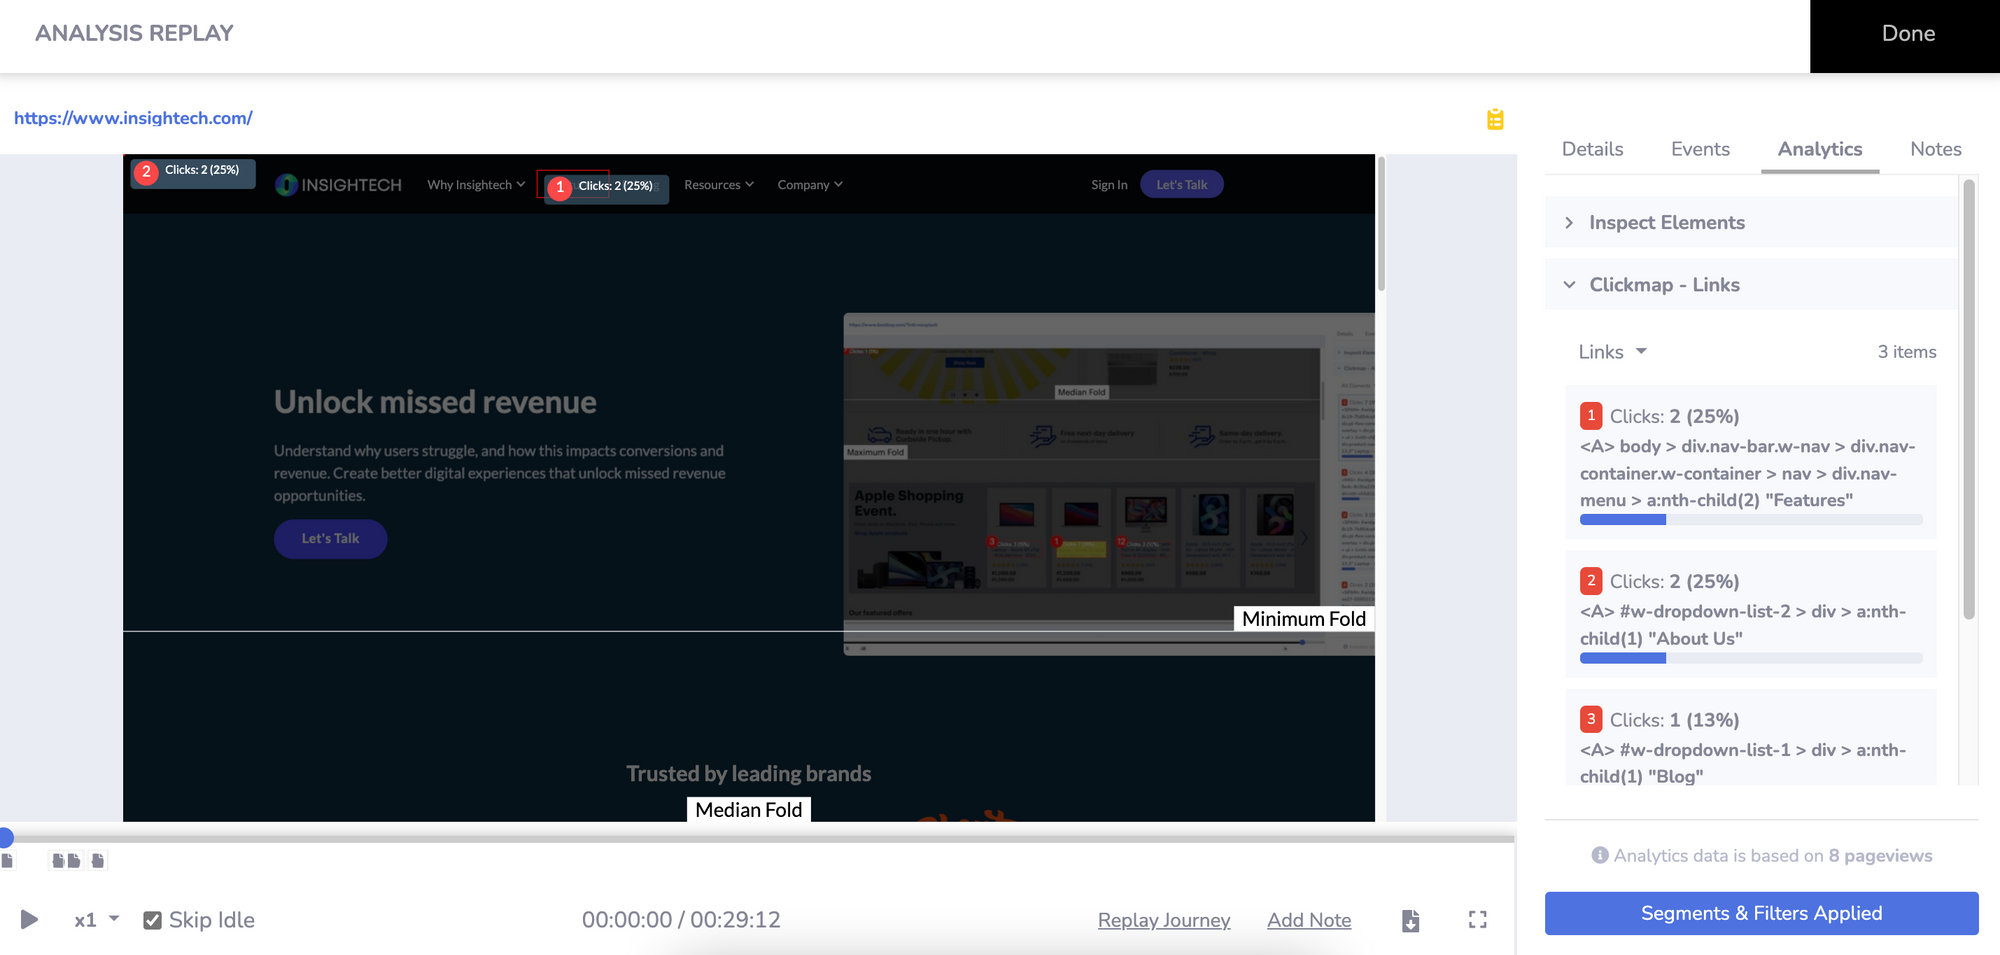
For instance, a Click Map offers an easily digestible way to visualise what's working (or not) on your website homepage for visitors arriving via SEO. Layering click and conversion data over your homepage enhances the visualisation experience, making data interpretation significantly easier than if it were presented in a table format.
Compare the pair:
- Traditional web analytics
2. Visual analytics
Building a Strategy for a Data-Driven Culture
While the Data Lake approach coupled with auto-tracking offers considerable flexibility, it's vital to establish clear measurement objectives. This doesn't imply drifting without direction—by setting precise goals, we can use the data to uncover invaluable insights even when events transpire as expected.
Lowering the barriers to gain insights from data is crucial. Utilising visualisation tools like Session Replays and Click Maps makes the data more comprehensible, but this doesn’t mean everyone will transform into a data expert overnight. Data should support specific roles within a team, not overwhelm them. It's essential to set the right expectations and build data literacy through practical workflows.
For instance, a marketing team can use Click Maps to understand user engagement on landing pages, leaving more advanced analytical tasks such as building data models for the data team. This thoughtful approach democratises data, breaks down data silos, and respects the focus of individual roles.
Culture is moulded by action. Atomic Habits" is a book by James Clear intended as a guide to building good habits while breaking bad ones. If you haven't read it you should consider doing so. Clear suggests that tiny, consistent changes in behaviour - 'atomic' habits - can lead to significant personal and professional development over time. Can we apply the same approach to analytics - "atomic analytics" perhaps? Digital teams can use Insightech's philosophy of visualising analytics to build stronger, repeatable, more reliable analytics habits. By progressively upskilling team members to work with data, you'll gradually cultivate a robust data-driven culture.
Key takeaways:
- Auto-tracking allows for the collection of all data points without needing to specify each one, offering flexibility for retrospective analysis and assuring data quality. As technology evolves, auto-tracking is becoming increasingly cost-effective and efficient.
- The Data Lake is a centralised repository allowing storage of all structured and unstructured data. In the context of digital analytics, this concept is paired with auto-tracking, providing businesses with flexibility, high data quality, swift implementation, and low maintenance effort.
- Tools like Session Replays and Click Maps can make data more understandable and can foster a data-driven culture within an organisation.