Why is my CTA not getting any love?
In this blog post, we are going to show you how you can find out the reasons people don’t click on your landing page call to action link with Insightech. With the insights you will find, you will be able to develop solutions to optimize your landing page.
In this blog post, we are going to show you how you can find out the reasons people don’t click on your landing page call to action link with Insightech. With the insights you will find, you will be able to develop solutions to optimize your landing page.
What we learned
Websites have different conversion goals so what we learned from the case of our client may not be exactly the same in your case, but we hope what we learned will inspire you to find the insights to optimize your landing page.
In this case study, a client’s website offered a free trial on their financial service product. But not many visitors clicked on the call to action links to start a free trial. We found that missing price information diverted visitors from the designed user experience.
Below is the process of how we gained the insights. Because of the non-disclosure agreement, we have to replace the actual page with our example page in the screenshot in this article to show you what it looked like to go through the analysis.
We also applied the learning to our own website design as we understand how important pricing information is
Search for the landing page footage
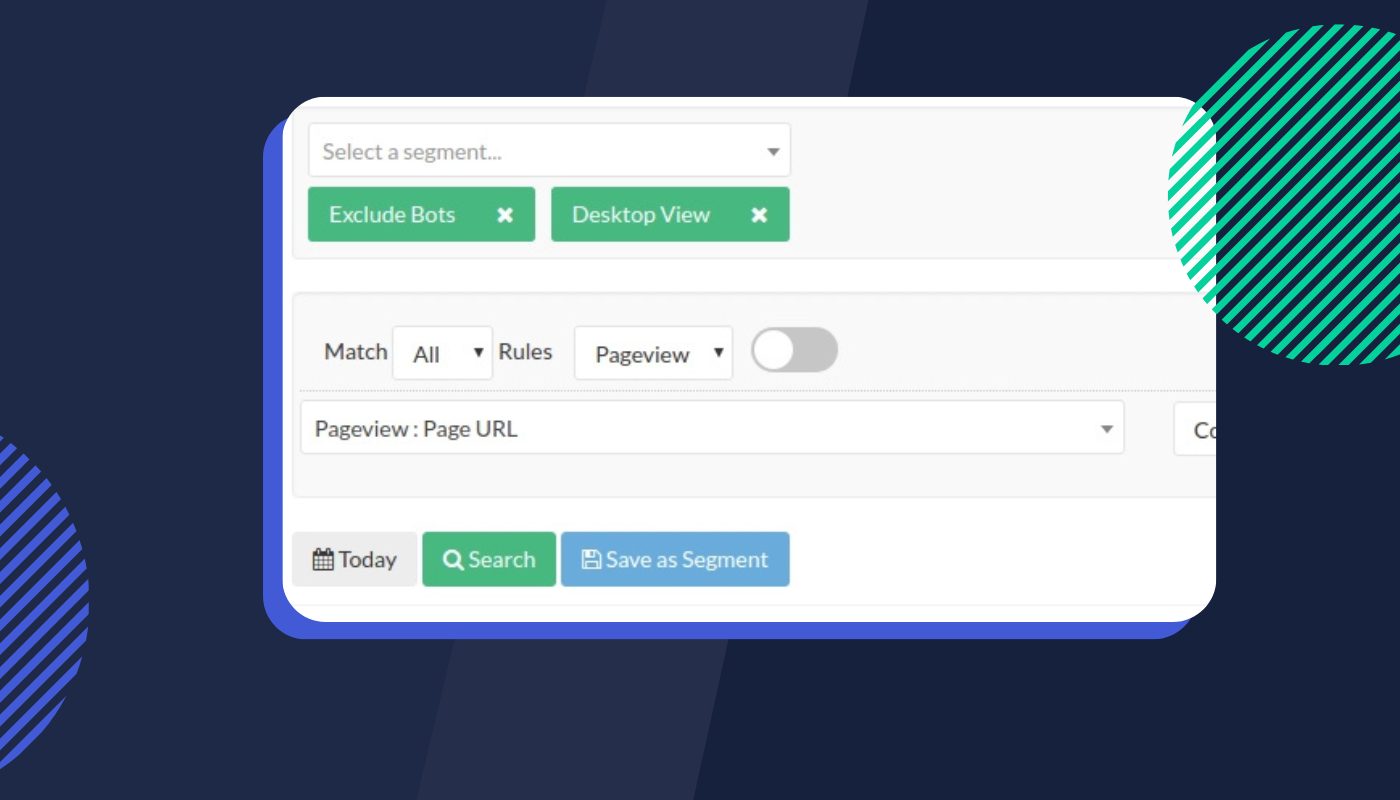
The client had a landing page /awesome campaign (this is not the actual page URL) that offered a free trial on their financial service product. The performance of the page was not great so we were asked to analyze the page to figure out why.
We focused on the desktop experience on the landing page first and decided to go through the mobile experience later as the majority of their traffic was from the desktop. We built search conditions to find the playback of the page on the desktop.
We picked a few playbacks from different browsers to watch. The purpose was to get a basic understanding of how the page looked like and to use the in-page analytics feature to get a quick overview of the playback user interface.
Get a quick overview of what happened
In the playback user interface, we paused the playback and enabled the in-page analytics feature to have a quick overview of how the page performed, more specifically, what links people clicked. The “Most Clicked Links” mode in in-page analytics is perfect for the job.
Below is an example screenshot of the click map with “Most Clicked Links” mode. Please note that the numbers at the top right corner of the highlighted elements are not the number of clicks, but the ranking of the clicked links. The actual number of clicks is shown in the right sidebar.

In the above click map example, it is our homepage. The number one most clicked link is our call to action button for starting the live demo on our website. But in the case of the client, it was very different. We wanted to find those who didn’t click on the call to action link to figure out why.
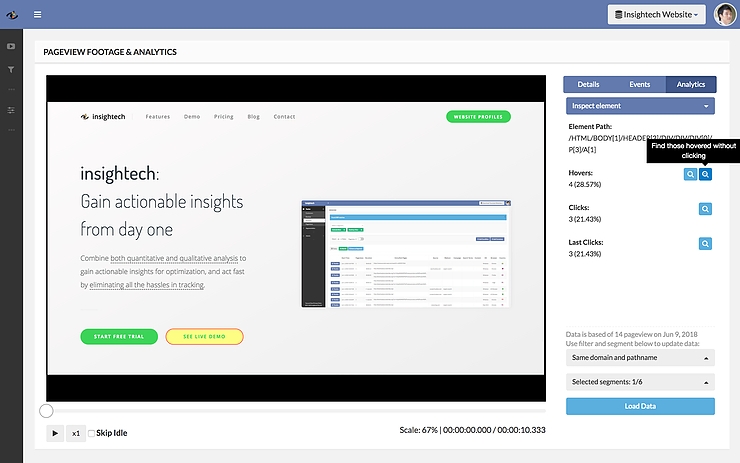
Inspect the call to action link and its stats
With the in-page analytics feature, we can inspect any element on the page when we pause the playback. We simply clicked on the call to action link to see the stats of how many hovers on the link, and how many clicks on the link. We found those who hovered without clicking on the link by simply clicking on the button shown in the below screenshot.
Watch what people did if they didn't click on the call to action link
Once we found all those who hovered without clicking on the link, we took some time to watch a handful of footage to see what else they did on the page. In this case, we found that in many footages the visitors clicked on the pricing link in the footer of the landing page which was difficult to spot. And the landing page didn’t provide any pricing information. That told us the pricing information might be crucial even if the client’s website offers a free trial.
Quantify the issues and prioritize solutions
The client wanted to know how big this issue was. Was it a minor issue we happened to find, or was it the key problem of the landing page? So we needed to quantify how many visitors clicked on the pricing link instead of the call to action link. That’s fairly simple to do because we already had the search conditions for those who hovered without clicking. We just added one more condition to narrow it down to those who clicked the pricing link instead, as the screenshot shows below
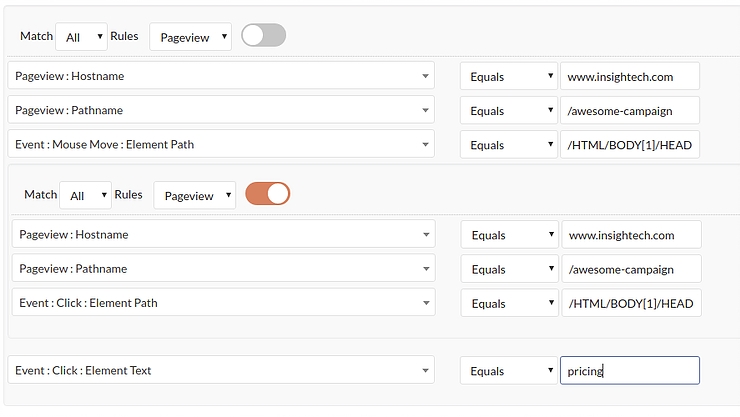
The search result gave us a number to work with. We also searched for those who clicked on the call to action link. It turned out there were more visitors who clicked on the pricing link than the call to action link.
Apply segments with in-page analytics
We saved the search conditions of those who hovered without clicking as a new segment and use the segment with in-page analytics to see what were the most clicked links on the page.
That gave us an overview of what were the links that “stole” the visitors from the designed user experience. Saving the search conditions as a segment is super easy. Just need to click the “Save as Segment” button, and give a name to the segment. Segments can be shared with teammates as well.
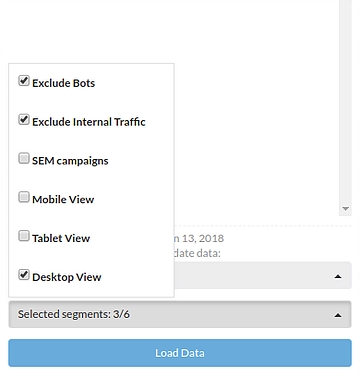
Once the segment was saved, we applied it with in-page analytics by clicking on the “Selected Segments” button at the bottom of the right sidebar, and then ticking the segment we just created.
After clicking on the “Load Data” button to refresh the in-page analytics data we used “Most Clicked Links” mode again to see the most clicked links by those who hovered without clicking on the call to action link.
We also had a segment of those who visited the page without clicking on the call to action link and applied the segment in the click map.
We confirmed that the pricing link, even if it’s in the footer and it’s difficult to spot, was more popular than the call to action link. There were clicks on other links in the menu and footer but each of them didn’t get a lot of clicks.
Note: This feature only works for Business plan and Enterprise plan clients.
Analyse mobile experience
So far, our analysis was focusing on desktops. How about the mobile experience?
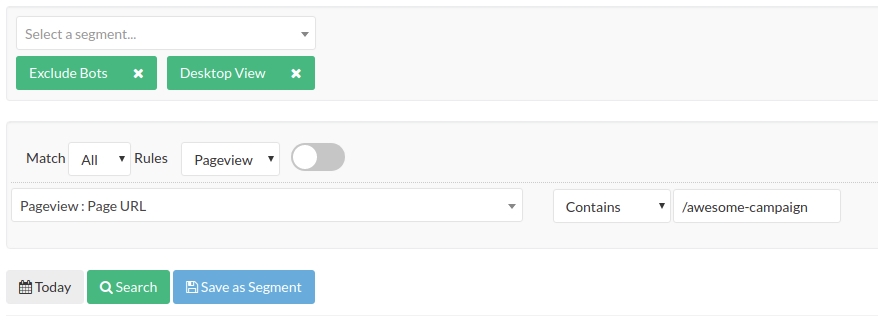
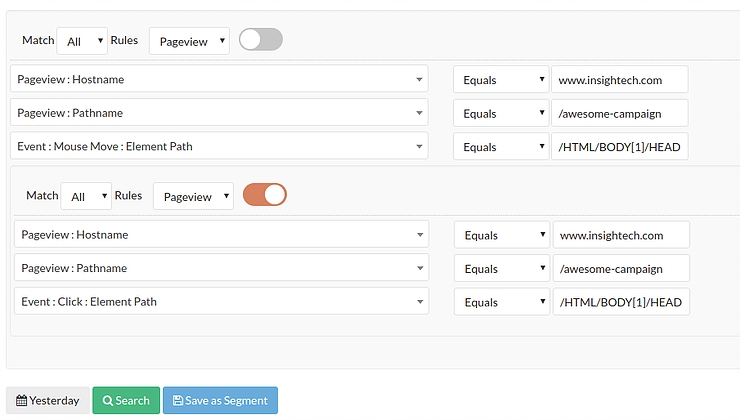
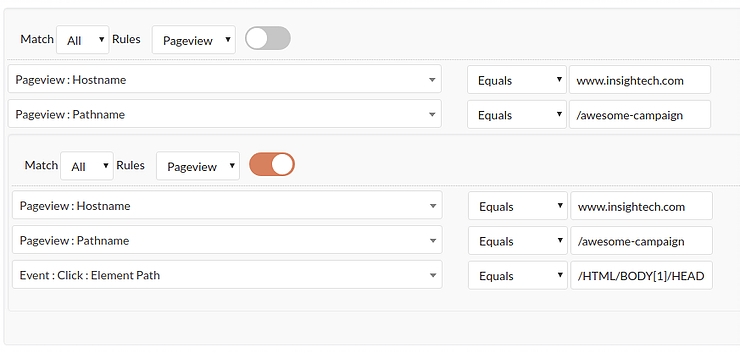
On mobile, there is no mouse hover, so we needed slightly different search conditions. We removed the mouse hover condition from the above screenshot.
It looked like the conditions in the below screenshot. These conditions help us to find those who visited the /awesome-campaign page without clicking on the call to action link.
We repeated the analysis similar to the above steps to find out why people didn’t click on the call the action link in the mobile view
In this case, it is the same reason, the pricing link.
Conclusion
Because we can search everything in the data, like clicks, mouse hovers and even page transitions and much more, we don’t have to watch thousands of random footage to try our luck.
We focused on those who didn’t click on the call to action link in our analysis and we could gain insight fast.
We provided the client with the insights we found, and recommended the client provide some pricing information on the landing page, as their pricing structure is fairly complex and difficult to be fully included in the landing page.